After a long hike or a cycling trip, looking at your track on the map is always satisfying. But GPX Viewer let you go much deeper than just seeing where you went. You can explore the elevation profile of your activity, check your speed data, compare performance across segments, and more. Let’s take a closer look at what the app offers for analysing your tracks.
The graph below the map
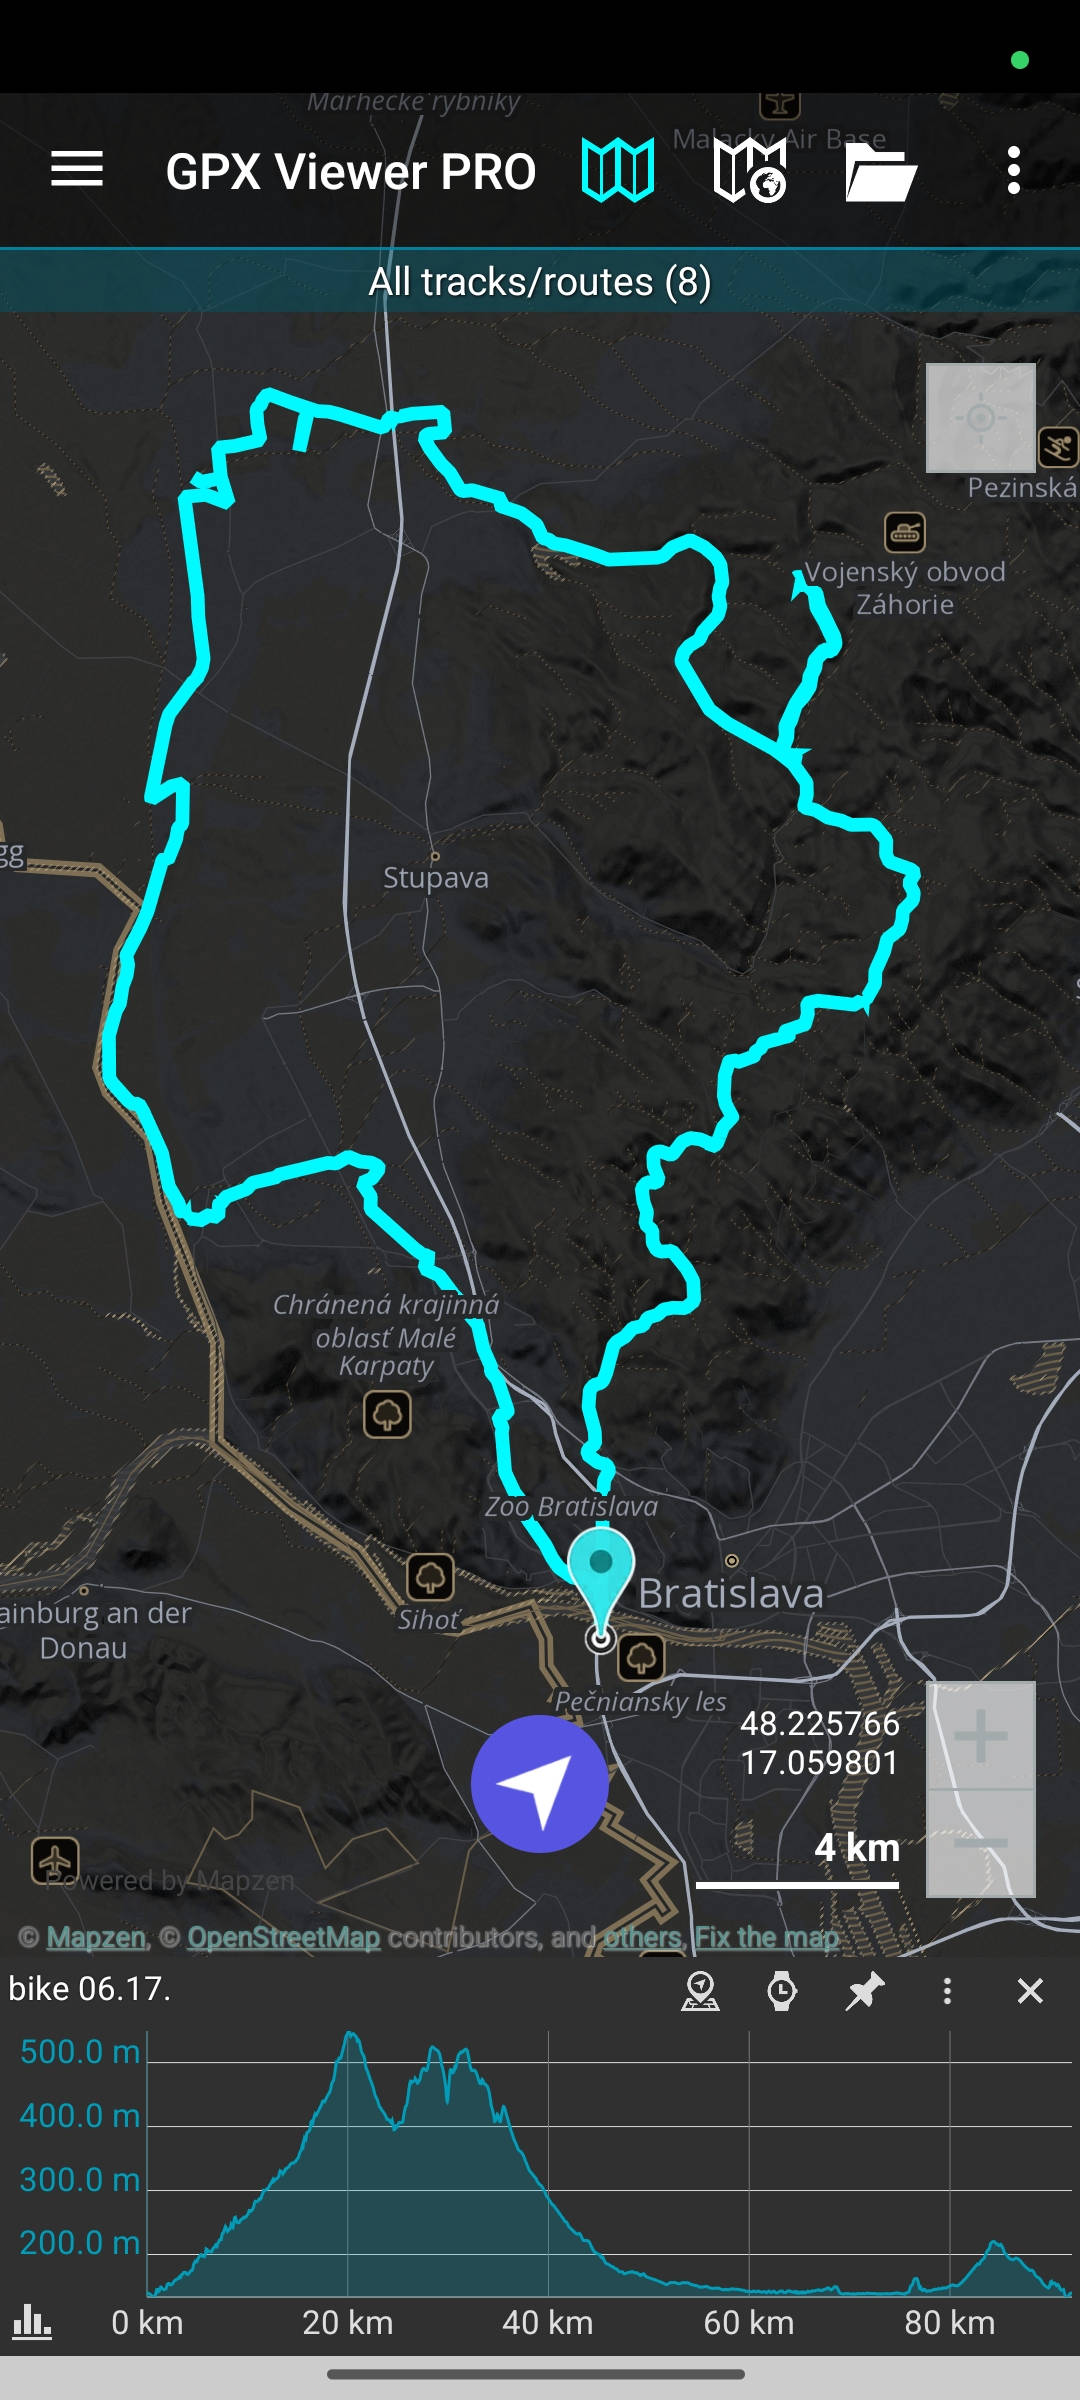
When you tap any track on the map and an elevation graph appears at the bottom of the screen. In case your track or route doesn’t have elevation data, you’ll see the Download elevation data button instead of a graph. Scroll through the graph and a pin moves along the track on the map, showing you exactly which point you are looking at. This helps you connect track data together with specific parts of your track on the map. This is especially useful when you are planning a hike and want to check where the steepest climb is — just scroll to the sharpest rise on the graph and you will see the exact spot on the map.
But the graph below the map has more to offer, let’s have a look at other options.
Switching what the graph shows
Want to display a different data type? The four bars button in the bottom left of the graph panel lets you switch between different types of data. Tap it and you will see the available options for your track. By default the graph shows elevation, but you can also select elevation change, and if your track contains additional recorded data, options like speed, power, or cadence will be available here too.
Graph toolbar buttons
The toolbar at the top right of the graph panel gives you a few more useful options:
- The location on map button opens the track stats screen with detailed information about your track/route (another way to open track stats is from the main menu).
- The watch button lets you choose which data to show on the X-axis. If you care more about how long a section took rather than how far it was, this option lets you look at the data that way.
- The pin button fixes the graph bar on the screen, so you can continue exploring the map. When this option is activated, the pin button turns turquoise.
- In the three dots menu you will find the following options:
Show direction icons option displays arrows along the track showing which way it goes.
Show distance icons option adds kilometer markers directly on the track, so you can see at a glance how far along each point is.

For long tracks, the graph can get compressed and harder to read. Enable Graph zooming using the three dots menu, and you can zoom into a specific section to see the data in more detail. If you are reviewing a mountain route with big elevation differences, turn on Zoom on Y-axis as well, which this lets you zoom the vertical scale so smaller changes become easier to read.
The track statistics screen
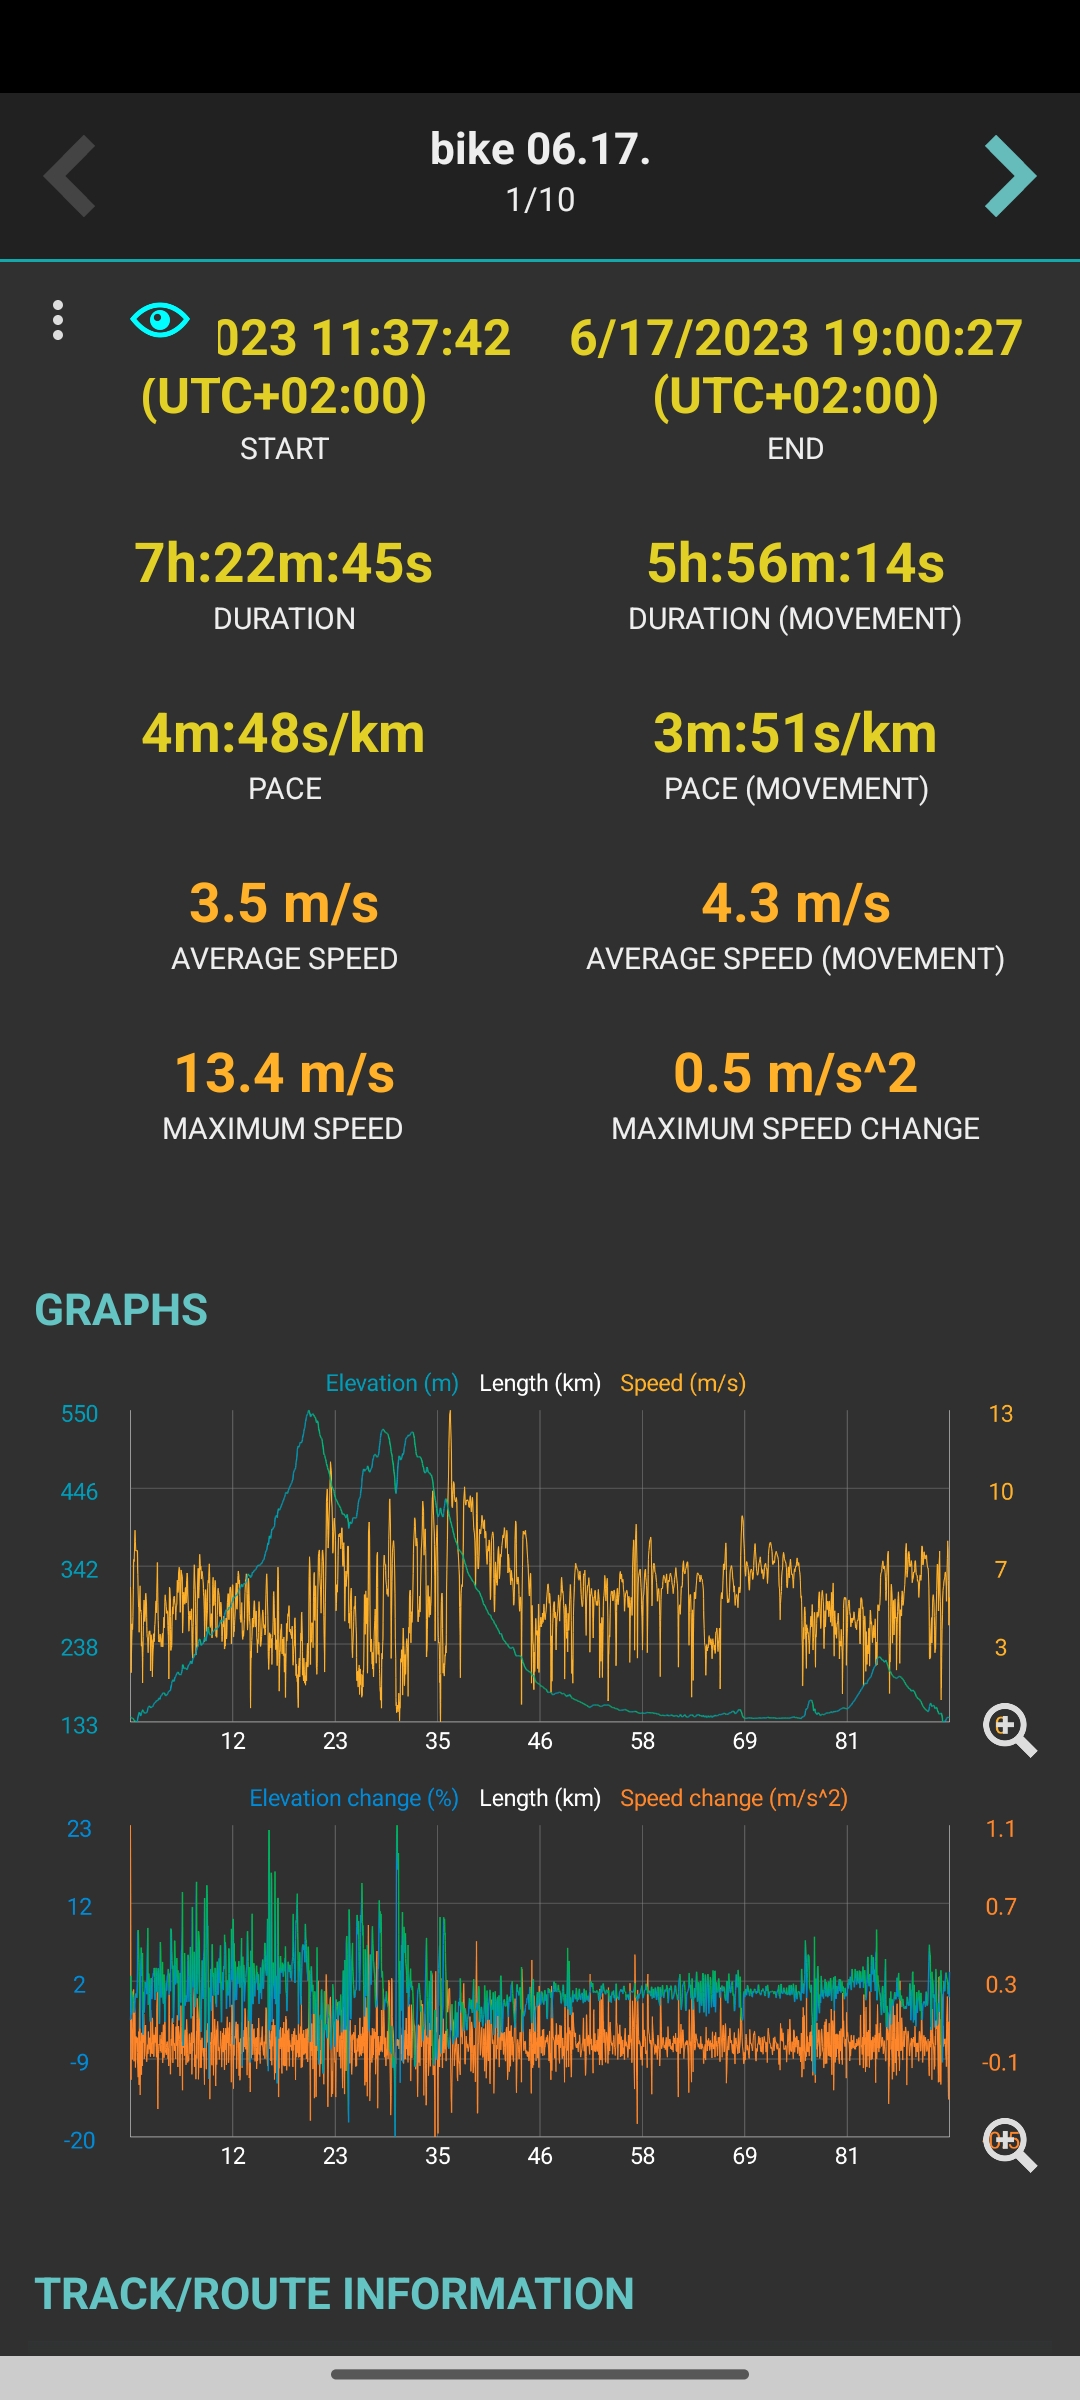
The track statistics screen is where all the numbers come together, it gives you a complete picture of your activity. You can open it by tapping the location on the map button in the graph below the map toolbar or open it from the main menu > Tracks > tap your track.
On this screen you can see the total length of your track broken down into flat, climb, and descent sections, total elevation difference, total climb and total descent, your start and end time, total duration and movement duration, pace, average speed, average movement speed, and maximum speed.
The screen also includes graphs. Tap a graph to open it full screen, there you can zoom in and scroll to inspect data for specific kilometers, this is useful if you want to understand what was happening at a particular point in your ride or hike.

Analyse your track segment by segment
The Show segments feature takes the analysis a step further and is particularly useful for runners and cyclists who want to track their performance in detail.
Tap the three dots icon on the left side of the track statistics screen and select Show segments. Now tap the three dots button on the right to define your segment size, for example every 1 km, every 2 km, or a custom value. The track is then divided into equal sections and the table shows you the data for each one: which kilometer it covers and the key stats for that section.
A runner can use this to check whether their pace was consistent throughout a race or training run, and spot exactly where they slowed down. A cyclist preparing for a hilly sportive can review each segment to understand where the effort was highest and plan the strategy for next time.

GPX Viewer gives you the tools to look at your tracks in as much or as little detail as you need. A quick scroll through the elevation graph takes just a few seconds. A detailed segment-by-segment breakdown of a long cycling route can tell you quite a lot about how you performed and where to focus next time.
And once you have the data you want to share, simply take a screenshot of the track with the graph or the statistics screen, you will find the Take screenshot option in the three dots menu at the top of the screen.